
Cosmograph: visual analytics for big graphs
Design service for team of scientists, designers and engineers building beautiful tools for visual analytics
Work with network graphs consisting of hundreds of thousands of nodes and edges right on your laptop
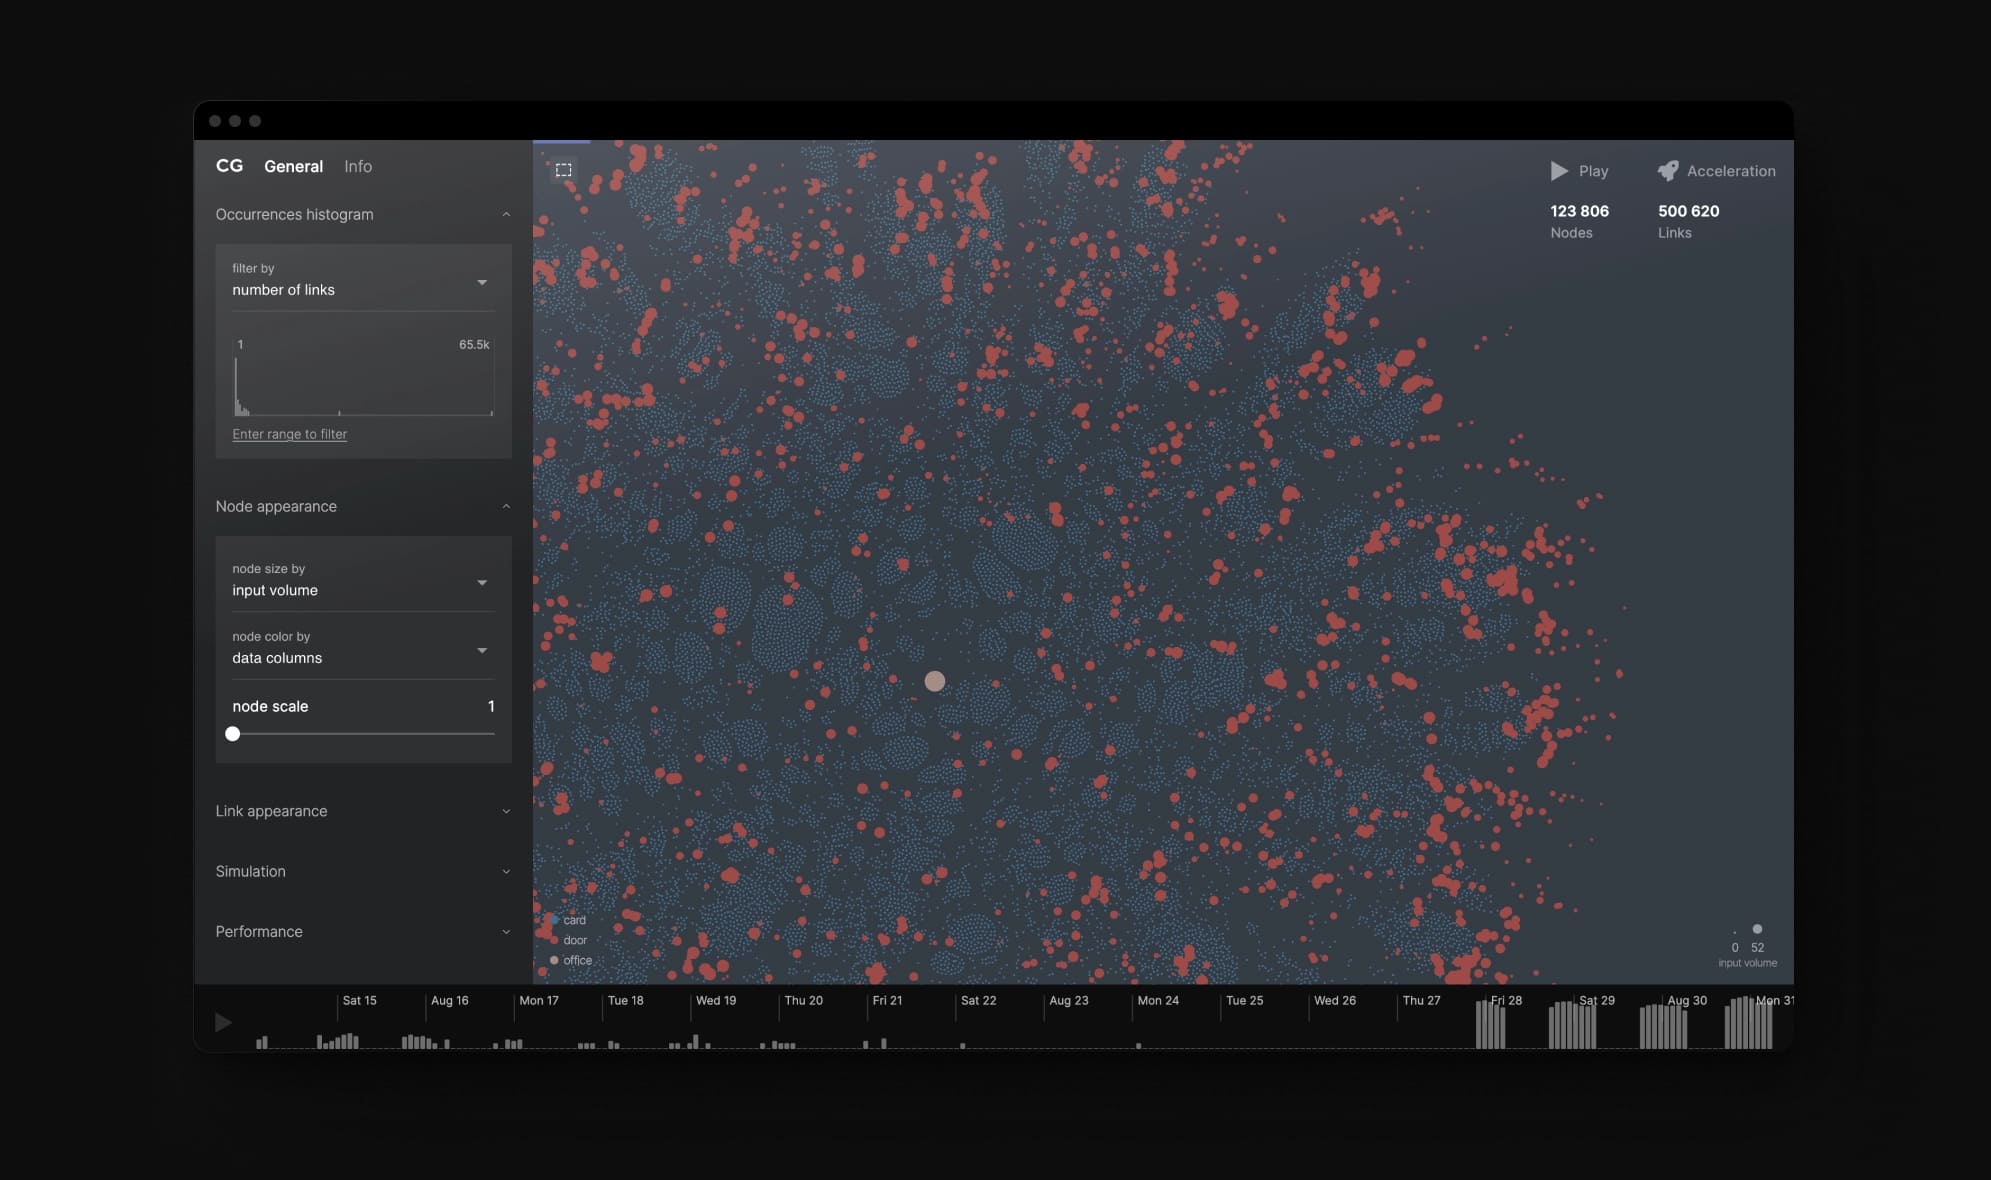
Main interface
Overview. Example visualization dataset 4 Tower Silo
· 80 676 nodes, 2 114 154 edges
A simple and intuitive UI allows you to quickly manage and customize the visualization. All elements are created on the basis of the atom method and are assembled into components. Also, depending on the type of data, various tools have been added, such as timeline and settings based on histograms in addition to standard lists.
The service itself is an open source project and allows you to expand its capabilities by the community, which is already actively used.
Overview
Try Cosmograph
With a reasonable trade-off in force graph simulation accuracy, Cosmograph creates graph layouts within seconds allowing you to explore complex networks in real time.
Cosmograph is a web-based app — it runs in your browser but it won’t send your data anywhere. All calculations will be done right on your GPU, the faster it is the better.
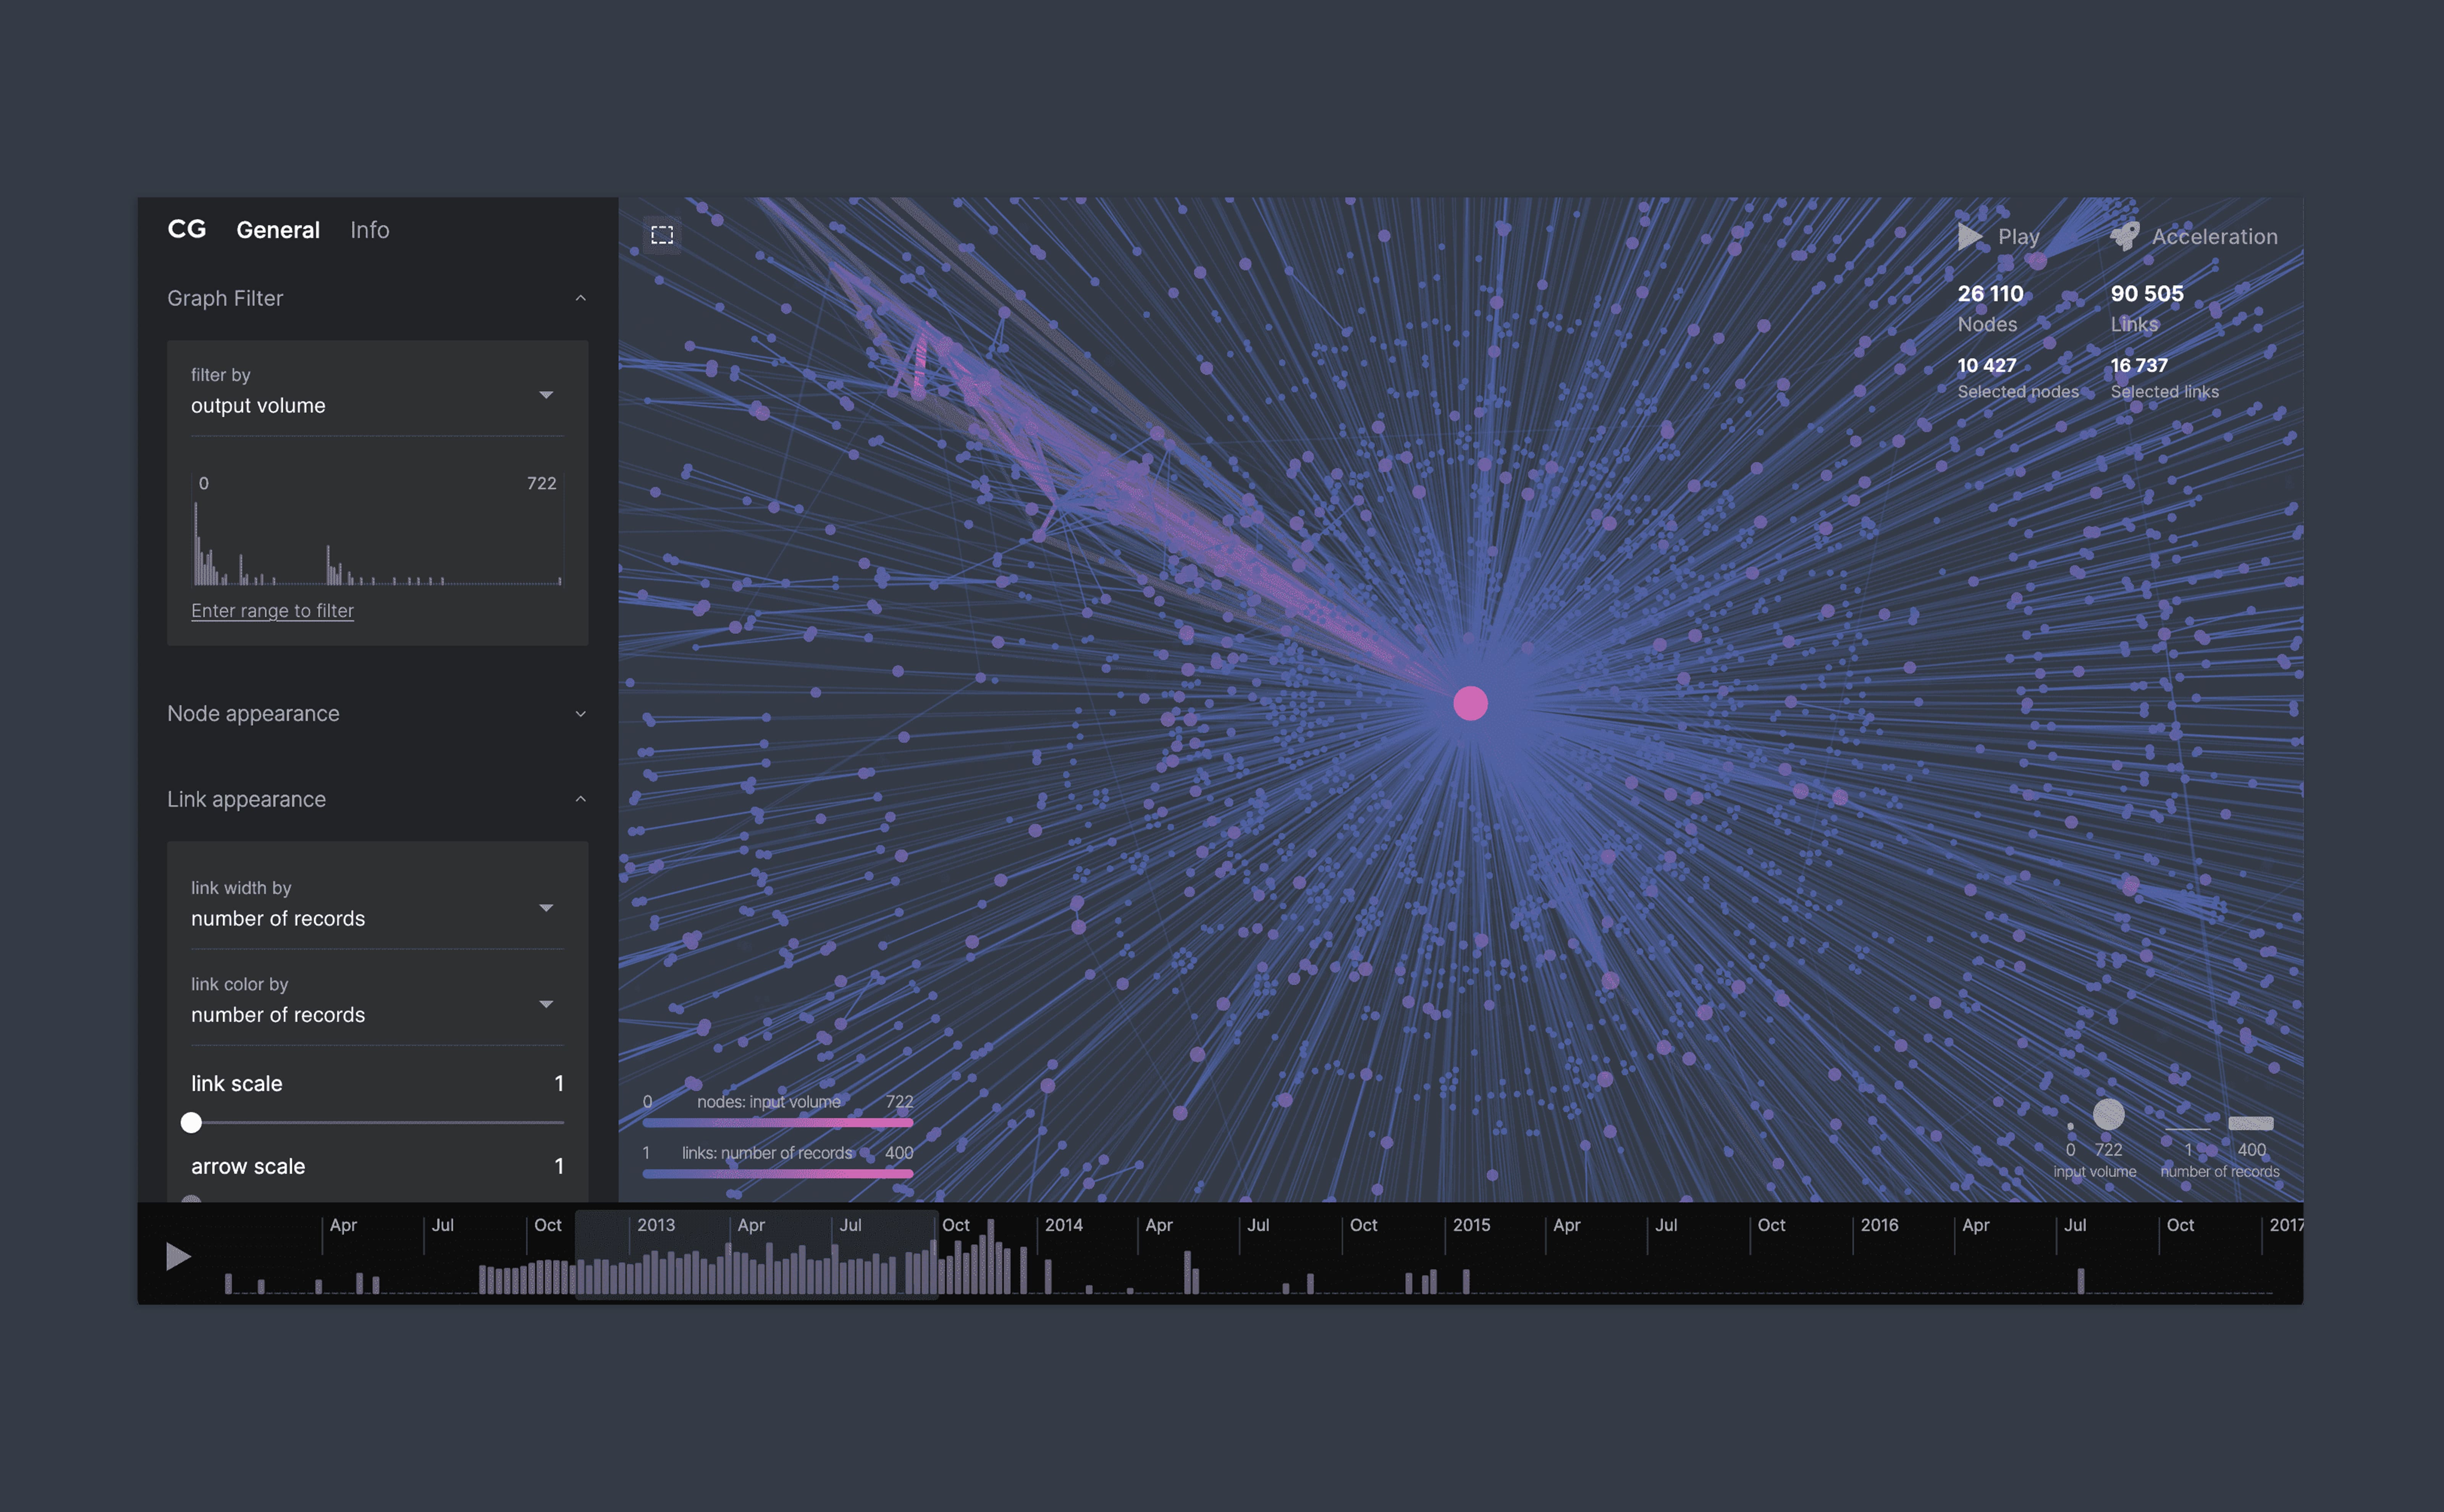
Main interface
Overview
Overview
Example visualization graph
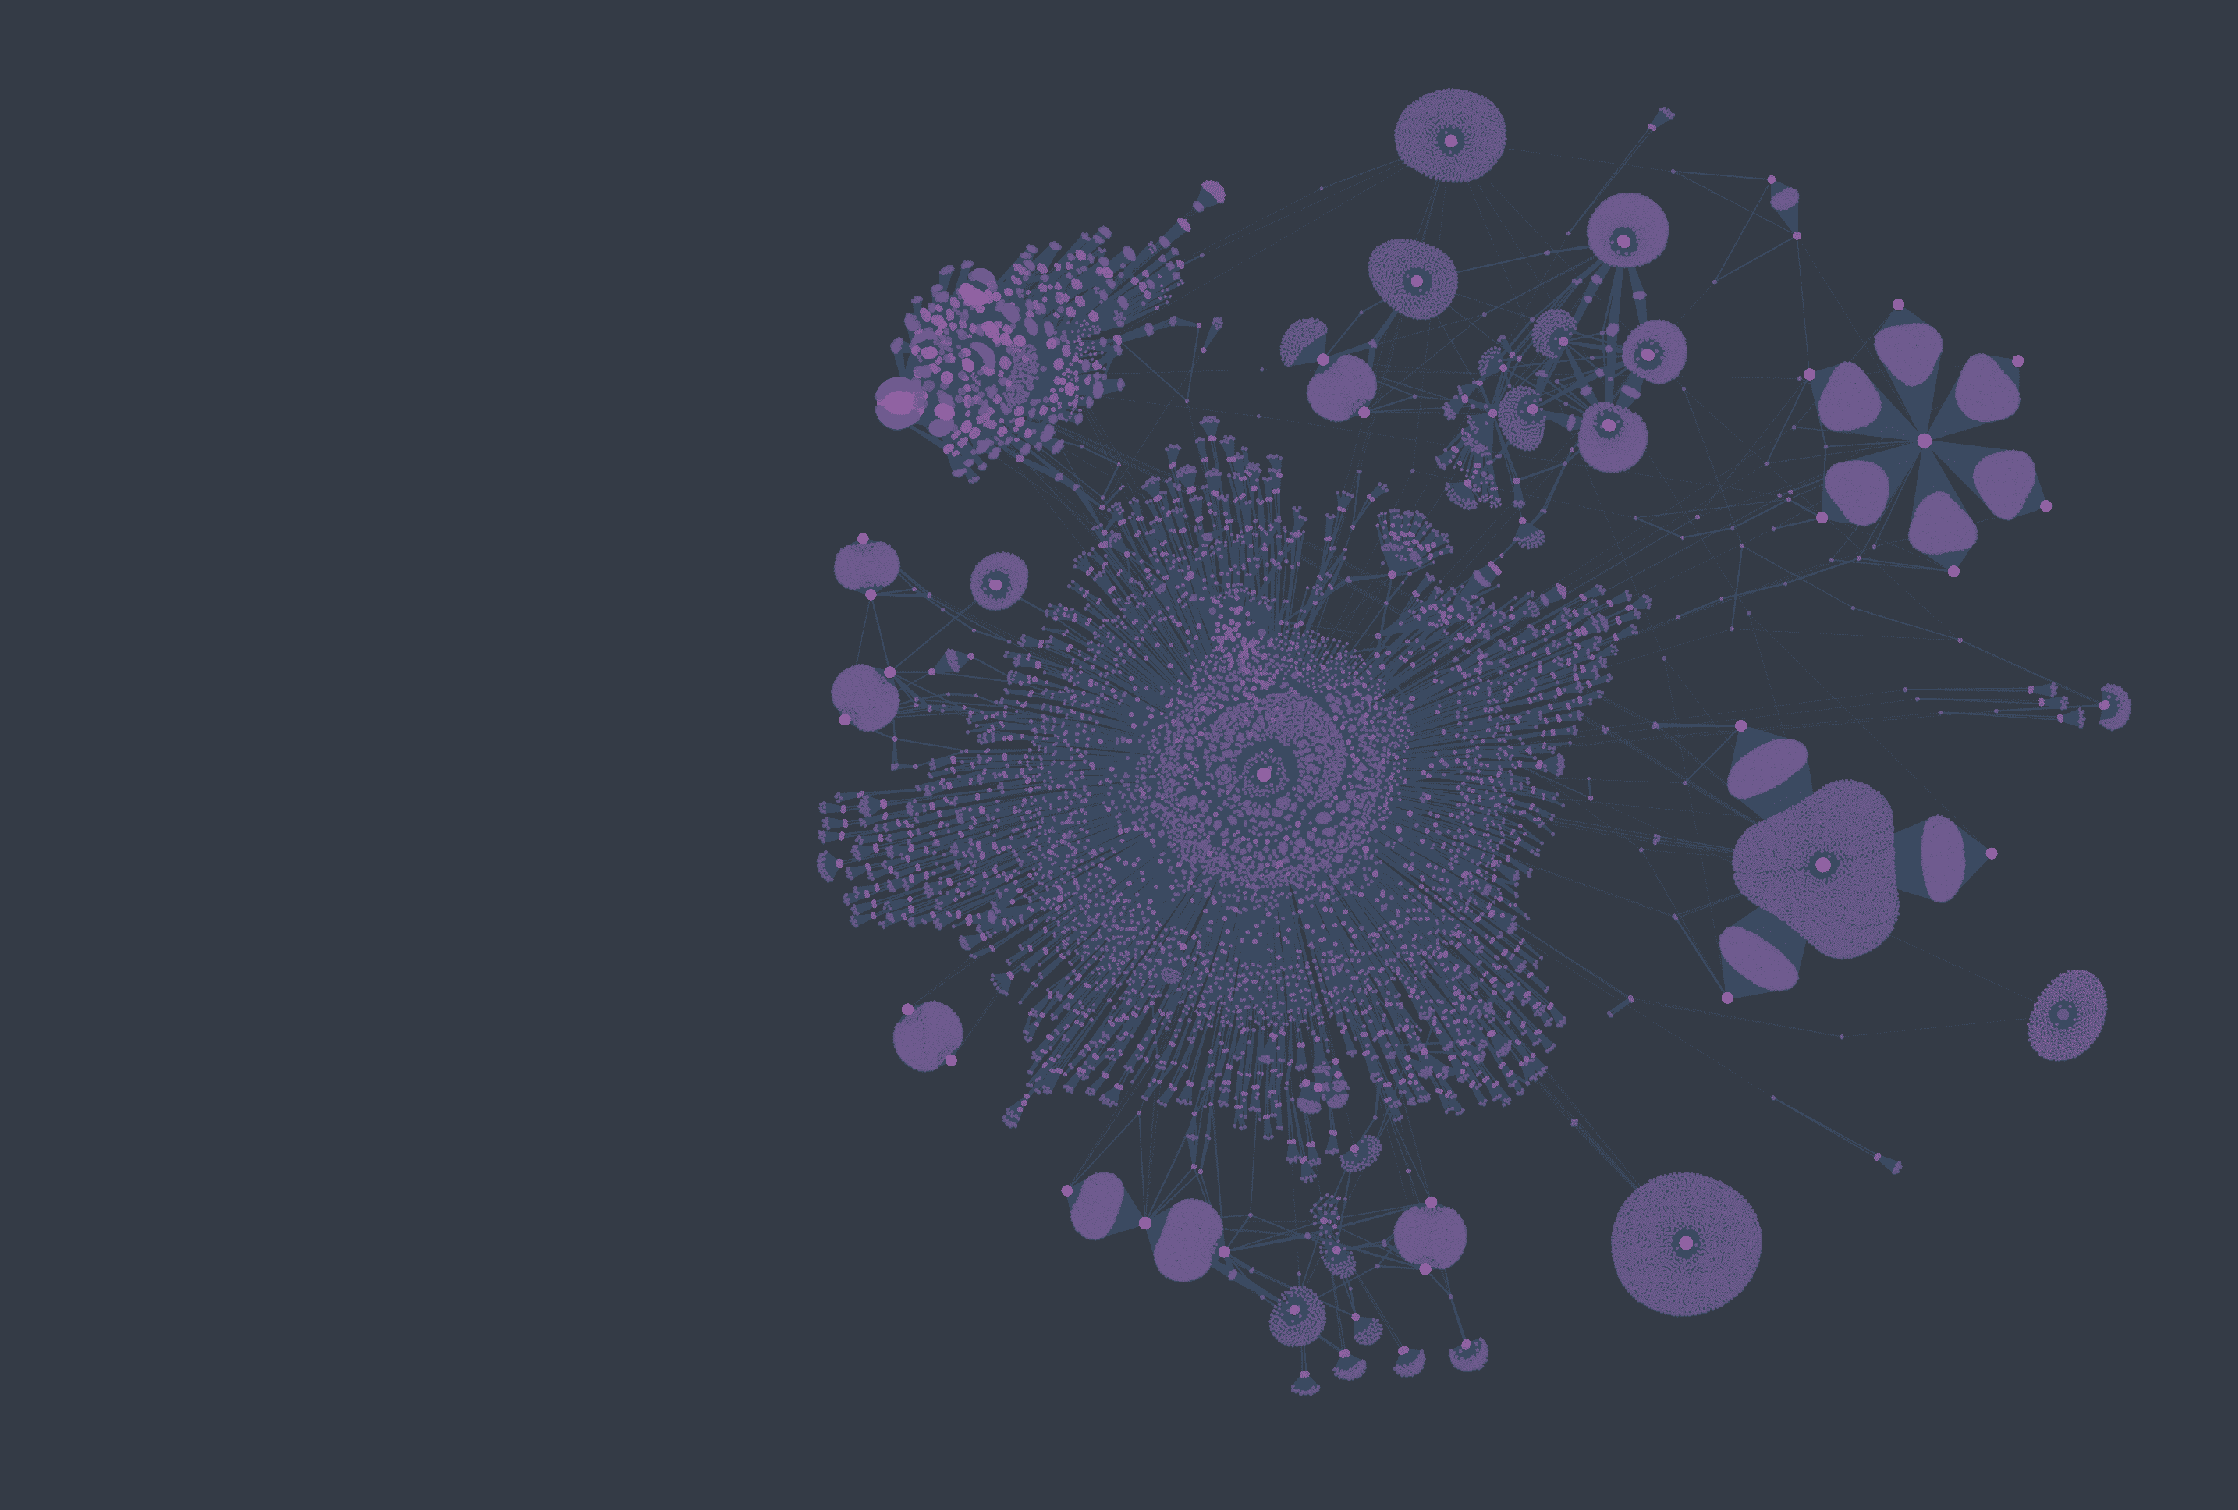

Synthetic graphs Generated graph samples
